Foundry Service Catalog
Designing of a catalog & data model to drive utilization of Ginkgo’s platform
Design thinking workshop
Dashboard design
Concept product vision
Design leadership
Discovery interviews
Card sort study
Design Challenge
A quick intro to Ginkgo Bioworks
Ginkgo runs R&D projects for customers (our customers outsource R&D projects to us)
Project work gets distributed across teams of specialized and generalized scientists
Generalized teams often request work from specialized teams
We call these work units “services”
Scientists didn’t have a single place to go and learn about the resources made available to them by other teams
From past user research, I heard that:
It was impossible to know how many scientific services existed (across all the teams)
It was difficult to find out what any service actually does
Services had playful names that weren’t descriptive, making it difficult to tell them apart
Most service documentation was written by specialized scientists and required too much background knowledge to understand
How might we catalog scientific services with an eye towards increasing the utilization of Ginkgo’s platform?
We heard rumors that teams were opting to go “DIY” and not use other team’s services
These rumors were concerning because it defeated the purpose of Ginkgo’s scale economics business model, and made some projects more expensive to run
Actions Taken
Generative workshop
Vision concepts
Concept testing & synthesis
Card sort study
Dashboard design
I organized and facilitated a workshop
This project wasn’t an assignment, I had a big idea for Ginkgo so I set off to explore it
I started with a workshop as a lightweight, low risk way to get ideas flowing
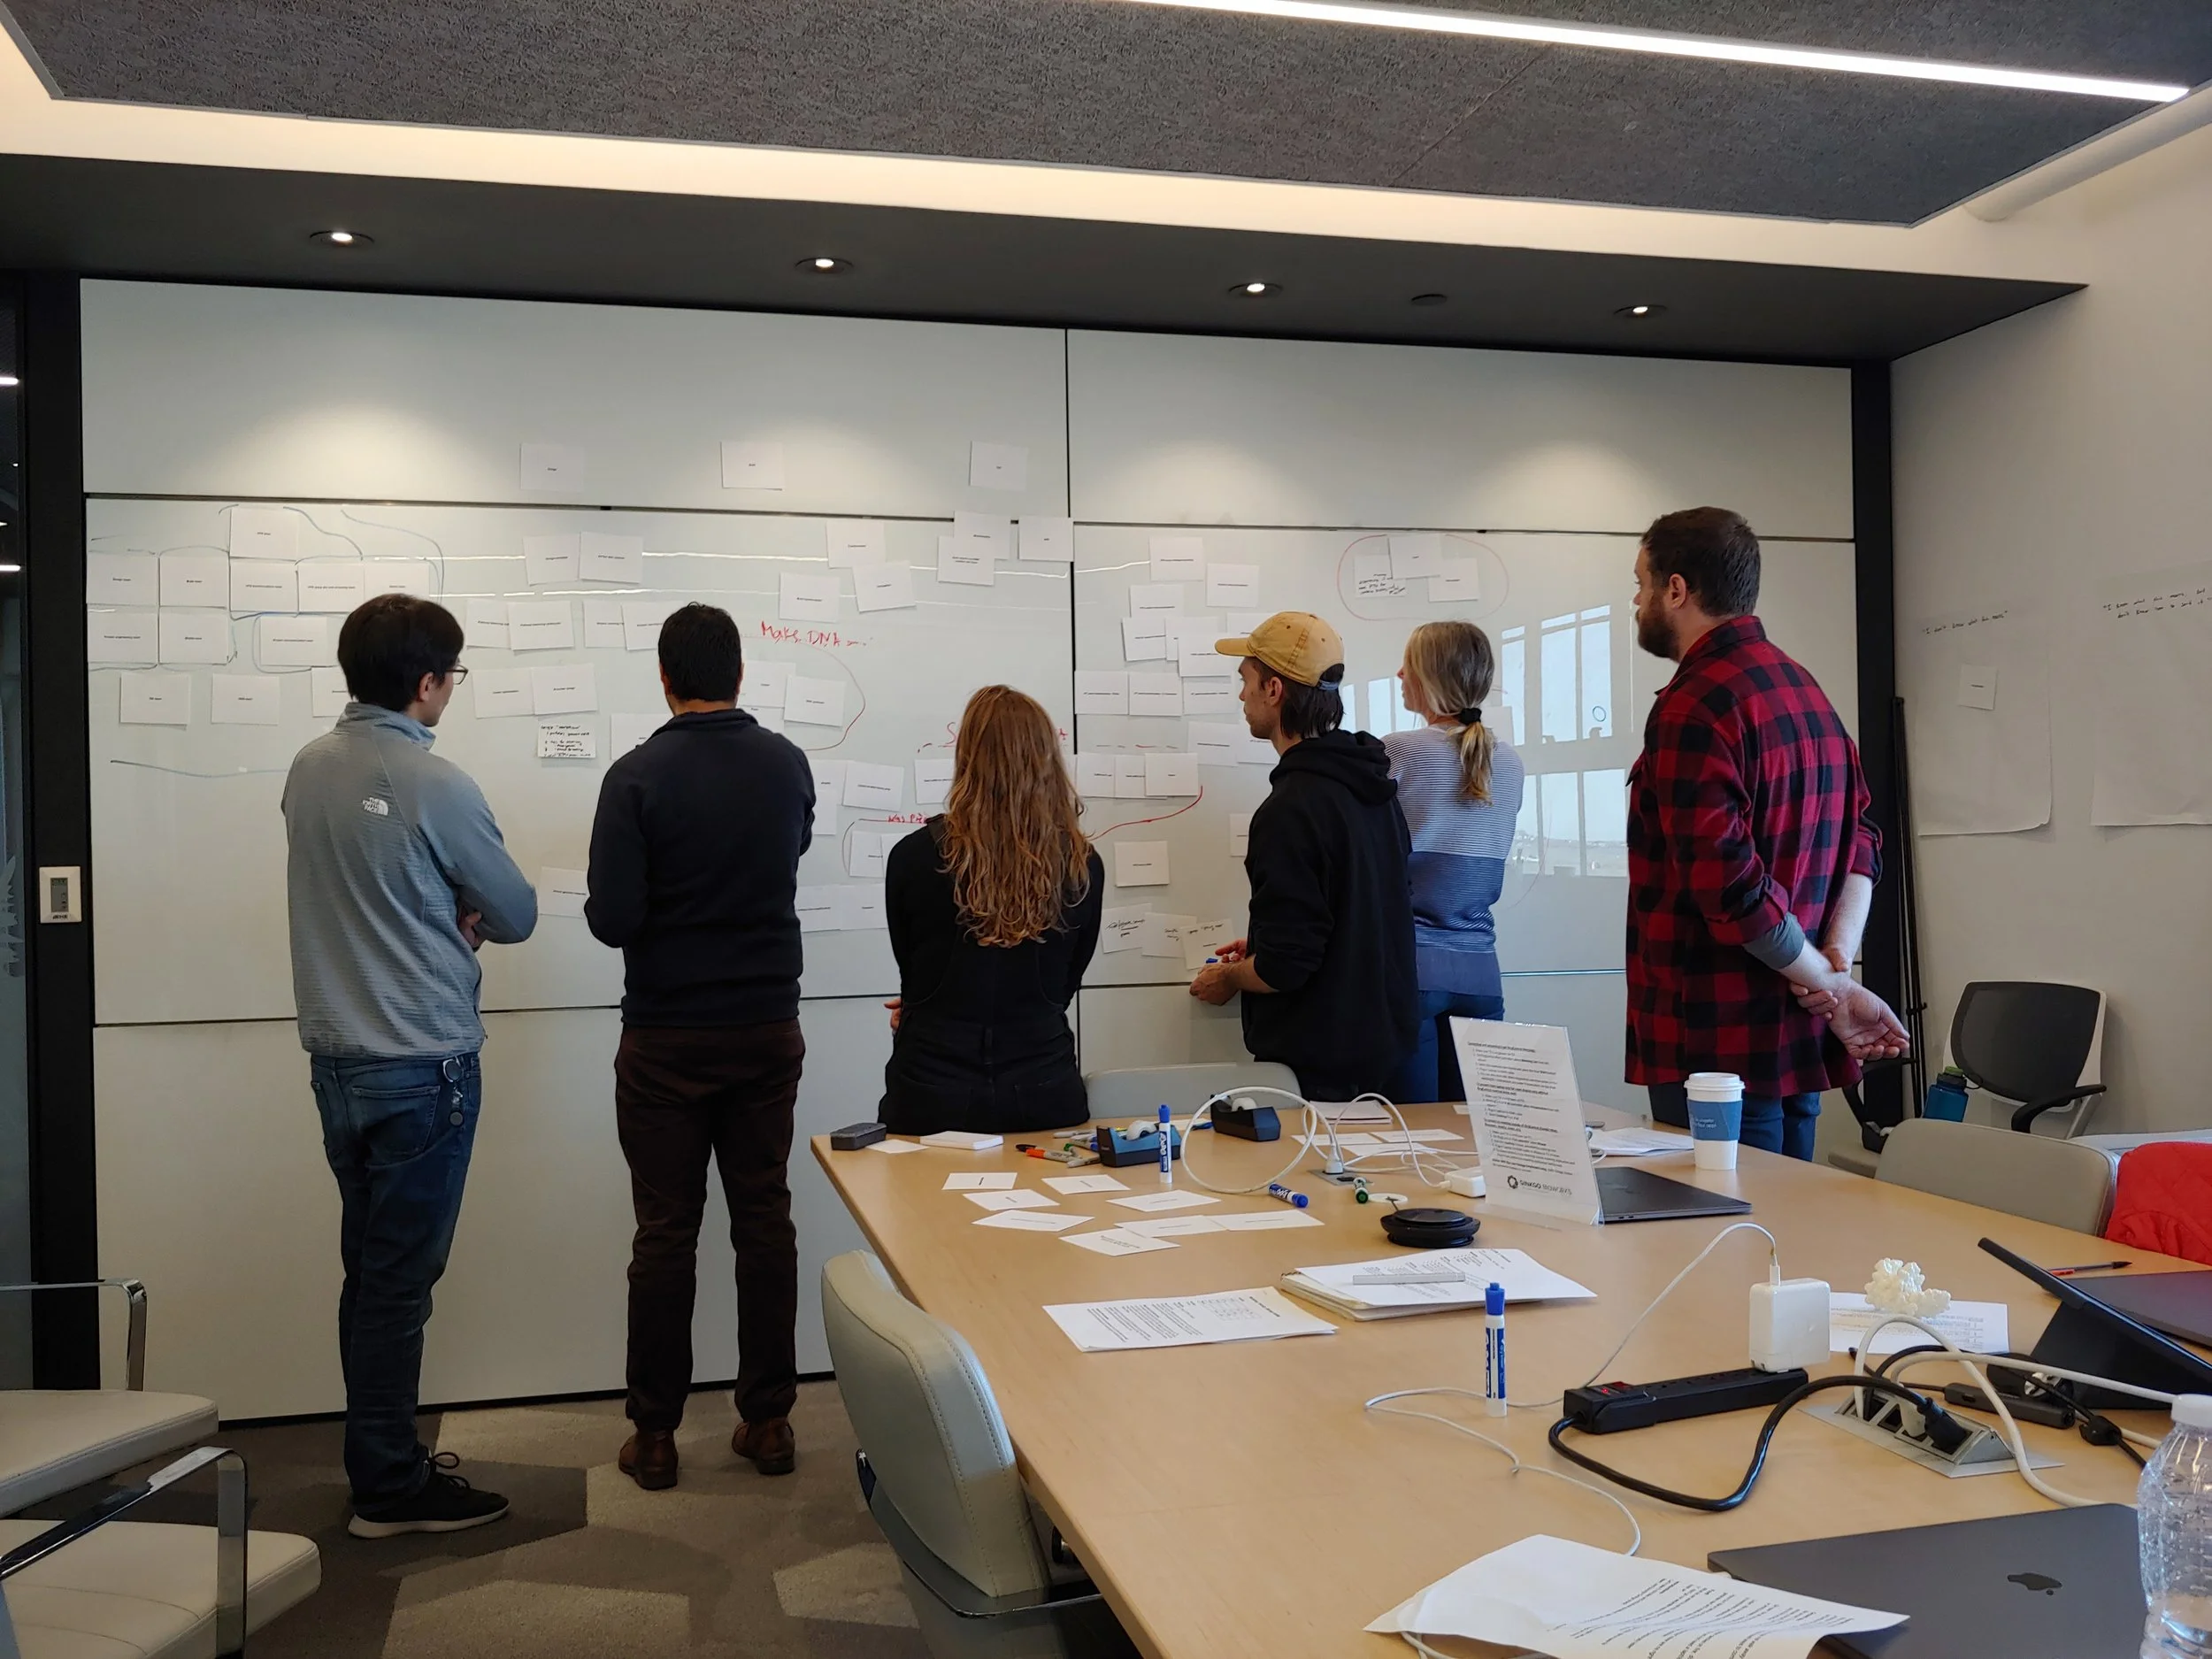
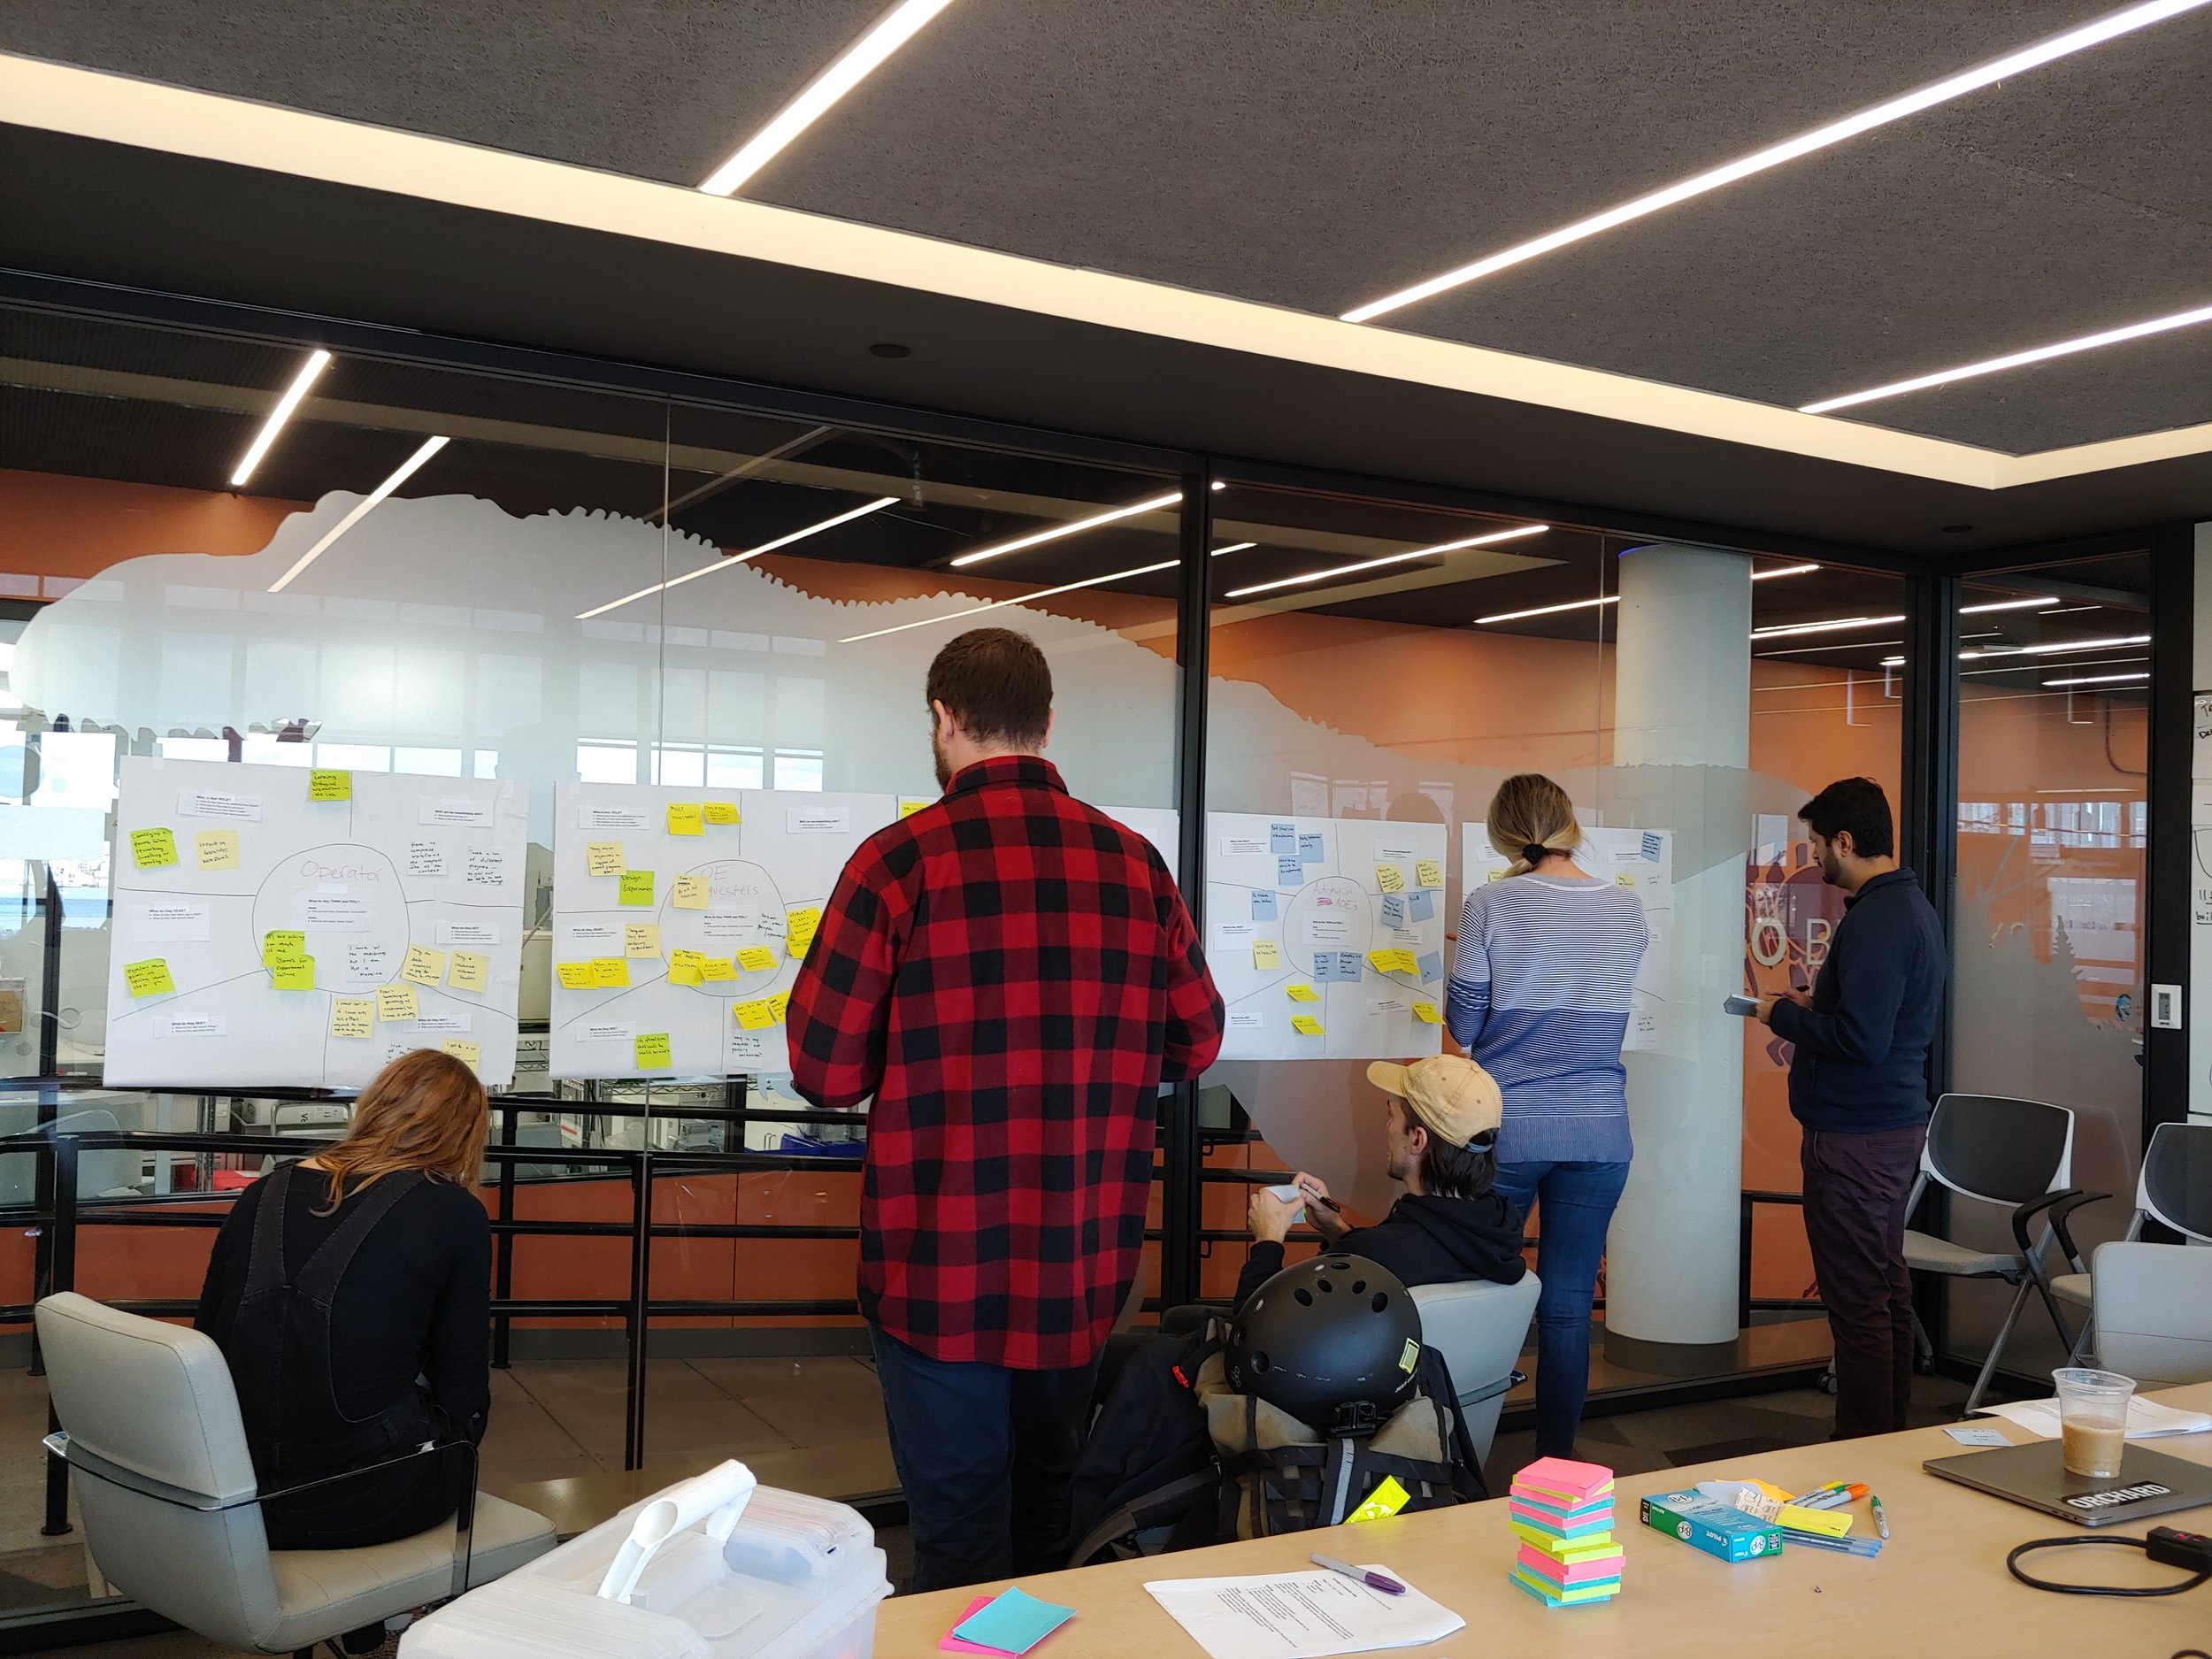
Action shots from the workshop 😎
Workshop activities
I used the book Gamestorming to quickly put together a workshop agenda. For the most part I ran each activity “by the book.” I chose the following activities based on my learning goals:
Open card sort - I printed cards with the names of as many services as I could find. I instructed the team to sort the cards into groups and label each group
Empathy map - I had the team make empathy maps for several key stakeholder groups
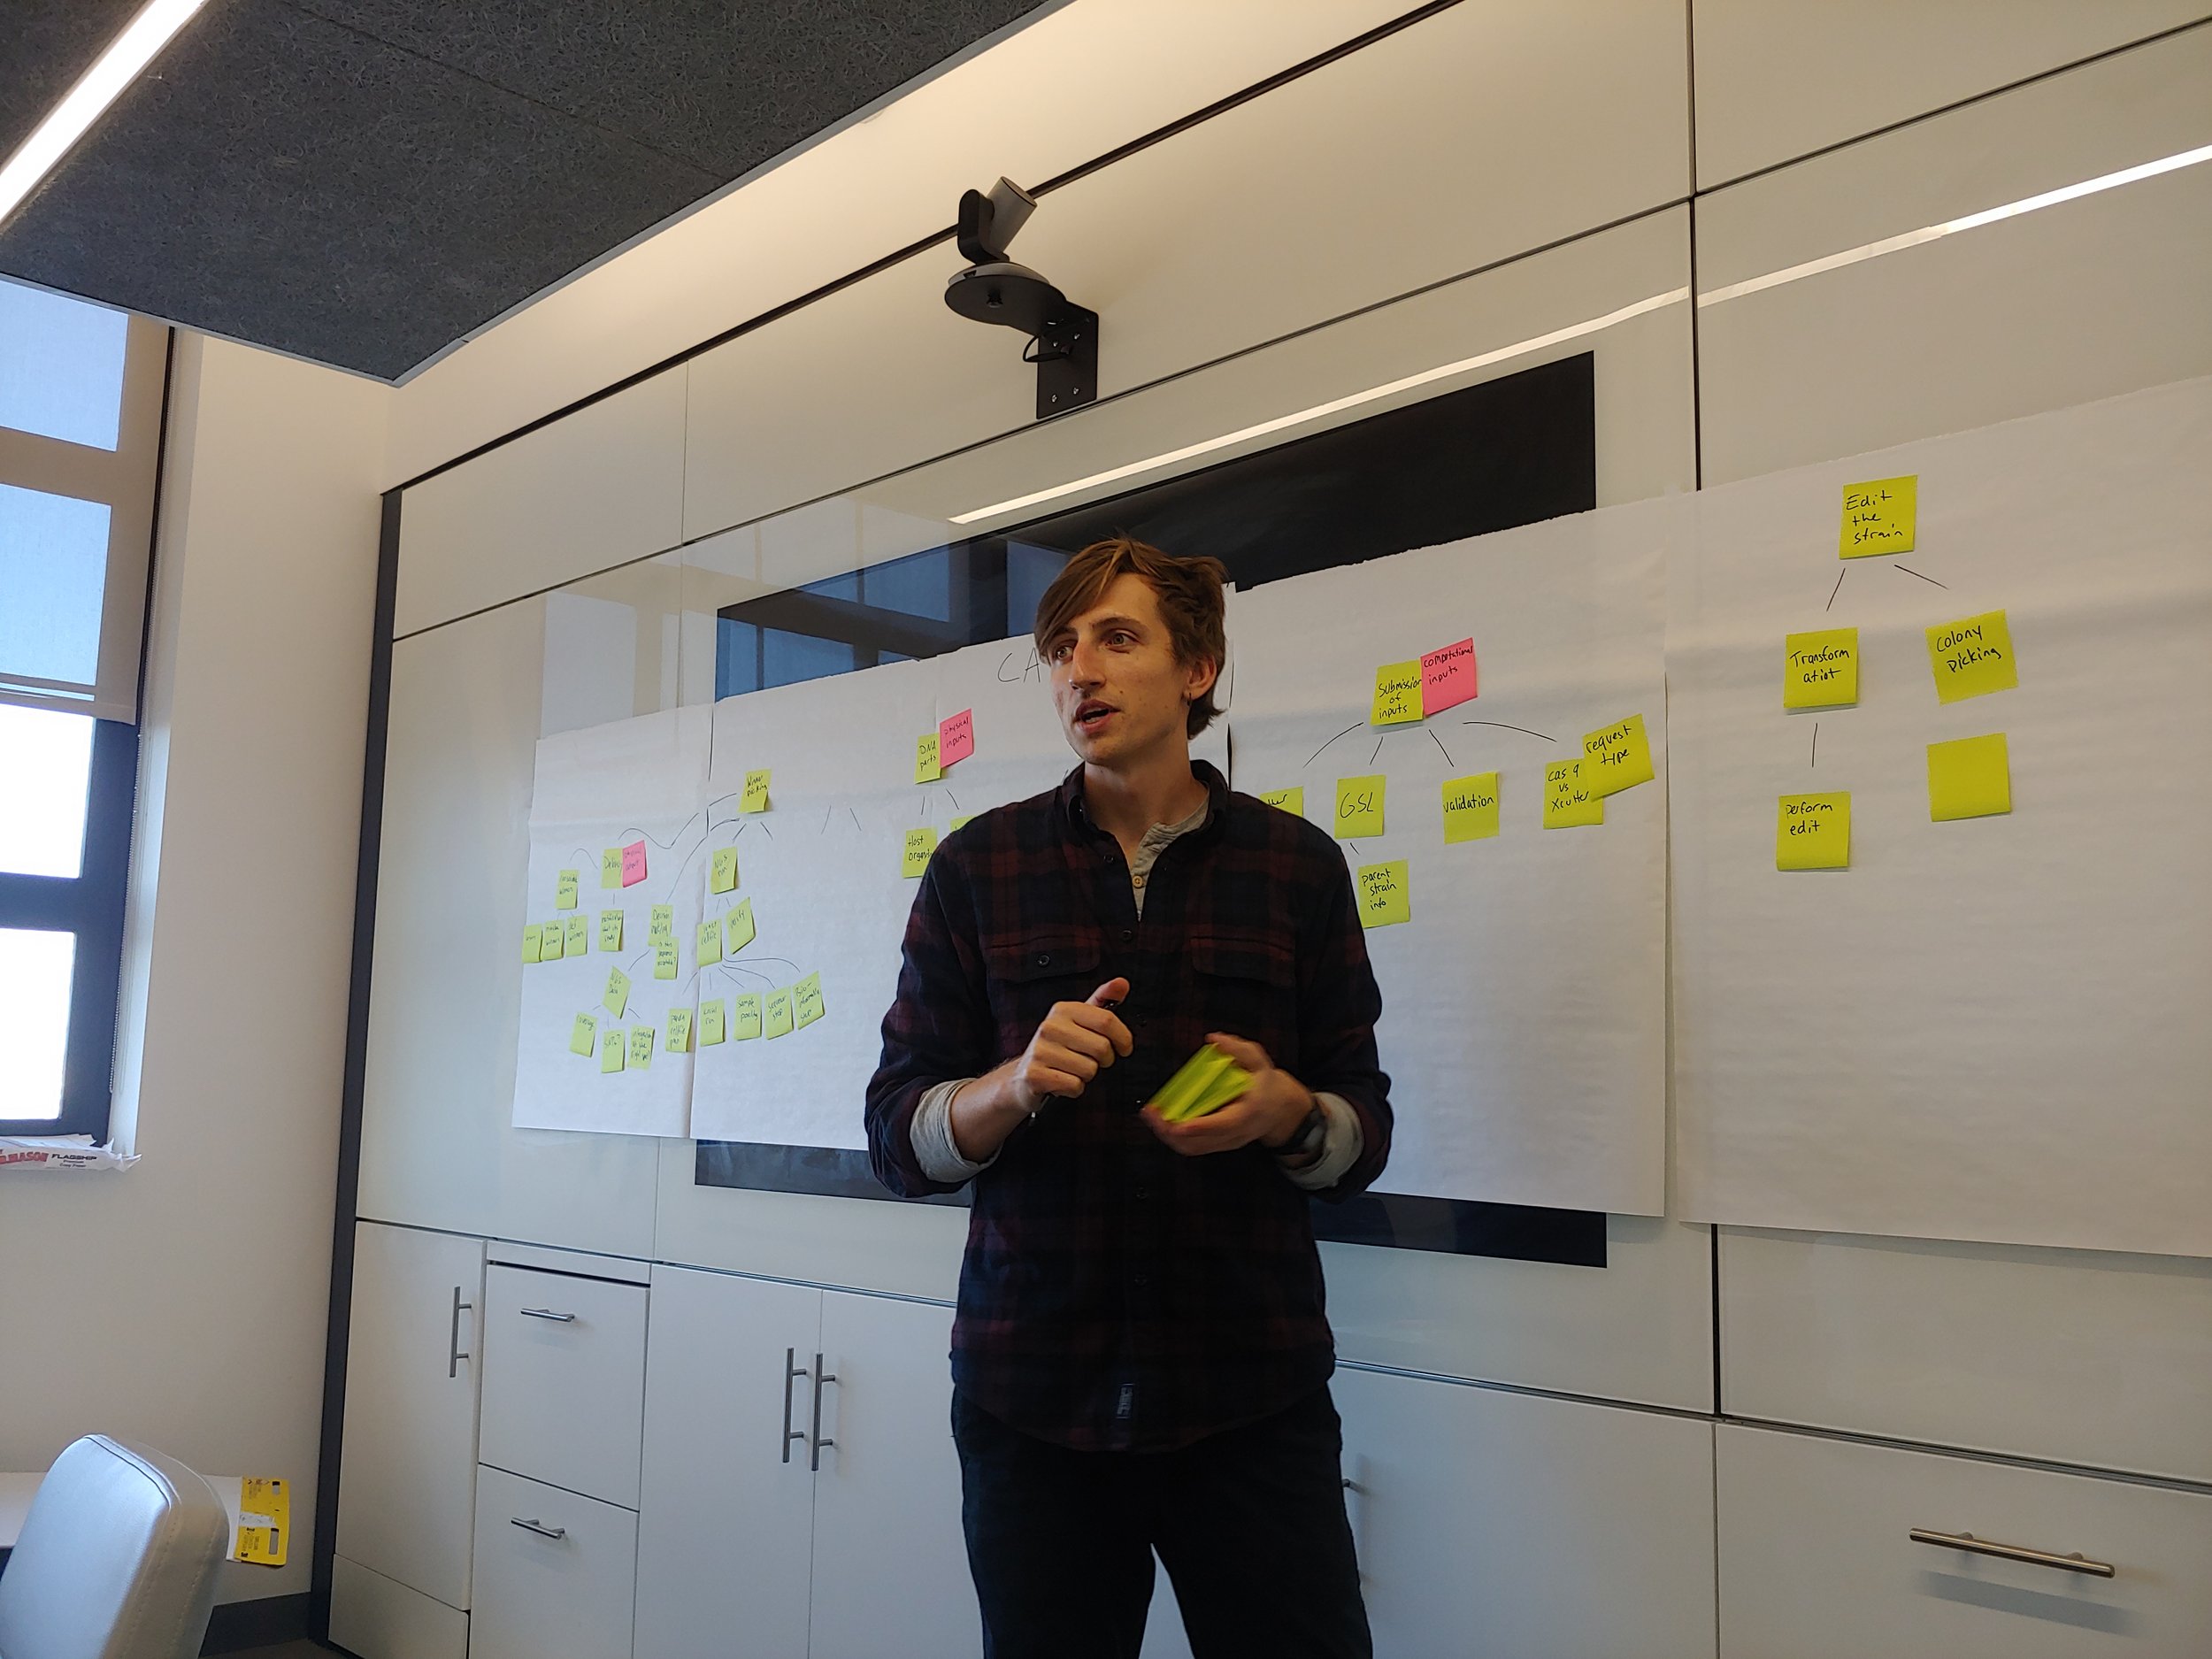
Atomize - I challenged the team to take a single service and break it down into it’s atomic components
Workshop participants
2 scientists
2 software developers
1 engineering manager
1 product manager
More action shots 🤠
The workshop uncovered several unmet needs, I was keen to translate our ideas into a concept vision
The workshop team came up with an innovative way to categorize services
I wanted to get their idea onto paper and in front of users as quickly as possible
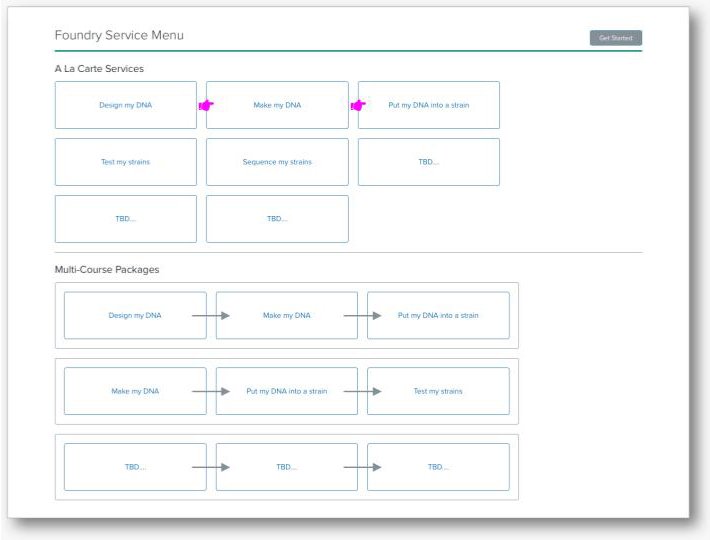
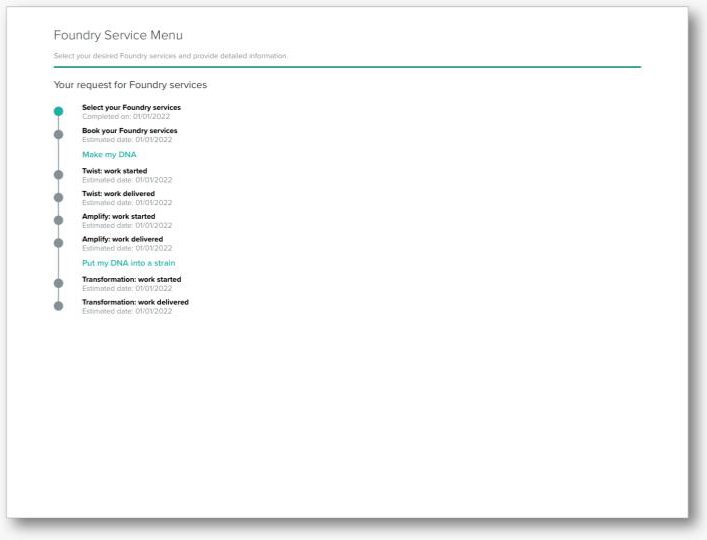
I mocked up a “menu” of services, incorporating a number of ideas from the workshop activities
I made the concept menu feel like a familiar shopping experience. At the time, the idea of shopping for services was a novel concept to many groups of stakeholders
I showed the concept menu to our target scientific users
I printed out the concept menu and made it into a booklet
I wrote an interview guide designed to uncover how teams work with each other
I gave each participant a marker and encouraged them to write on the menu as they answered questions
I took notes during each session, synthesized the data, and wrote a report
Scientists were opting to go DIY because they didn’t have the info to find the services they needed
They said it was difficult to locate information and choose the right service, it was often easier to just do the work themselves (they referred to this as “DIY”)
Participants confirmed they had a hard time keeping track of all the available services
New employees struggled most, it could take months before they felt comfortable collaborating with other teams
How project teams decide when to use services vs go DIY:
Cost per sample
Logistics of planning + submitting experiments
Minimum number of samples required to run the service
Turn around time (DIY is often faster for small jobs, services faster for big jobs)
Key information they need to make this decision:
Service inputs (what they need to provide)
Service outputs (what they get back)
Turn around time
Cost
Biological restrictions (e.g. max number of base pairs per sample)
Capacity restrictions
Service run schedule
A contact for questions
A brief description
We were surprised how much participants talked about “shopping” for scientific services. They spoke in the same way one might talk about selecting a “regular” consumer product.
I advocated for the research findings and secured resources to keep working on the problem
I brought the research findings to the Product team and secured time on the quarterly roadmap
I worked with scientific leadership to establish KPIs we could hold ourselves accountable to
I advocated for adoption-based KPIs because the product wouldn’t deliver value unless people chose to use it
At this point I felt confident in the product market fit and wanted to push the concept forward
We needed an information architecture for the catalog
I knew the effectiveness of the catalog would hinge on how well it was organized
Information architecture would be key to the success of this new product
The workshop uncovered a handful of categories I could use as a starting point
I ran a closed card sort study
Research method details
I included 37 cards sorted into 10 pre-determined categories (categories came from the workshop)
Each card contained the name of 1 service
I recruited 10 participants (scientists across a mix of teams)
Sorting was done digitally using Mural - I gave each participant their own white board with the cards and categories, they had 1 hour to sort
I exported each whiteboard as a CSV, cleaned the data, and joined into a single spreadsheet
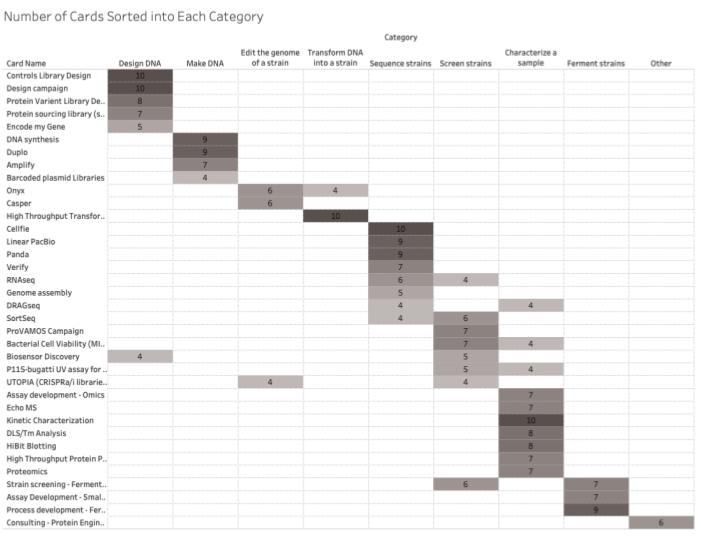
I imported the spreadsheet into Tableau and plotted a heat map
Example output of a single card sort session
Heat map of card sorting data. I played with the row and column order to reveal a pattern in the data
I used the card sort results to organize the first iteration of the Foundry catalog
The card sort gave me the insights I needed to move forward
The card sort resulted in a number of categories I could confidently build a design upon
Other categories were still rough around the edges, however I felt the best way forward was to build a functional prototype and populate it with real data
Quotes from the study:
"I didn't know we have this"
"Sequencing makes more sense than sequence strains"
"Characterize a sample… that seems sufficiently vague"
"I honestly don't know where the protein stuff is gonna go"
"Design a protein... does that mean design DNA?"
I made a functional catalog prototype and asked science teams to fill out the content
I worked with the Data team to set up an easy way for scientists to start populating data
I wrote guidelines on best practices for filling out the catalog information. The best practices were inspired by insights gleaned from prior rounds of user feedback
I worked with Ginkgo’s science leaders to encourage their teams to populate the new catalog. Once the leadership team was bought in, it was easy to convince scientists to populate the dashboard
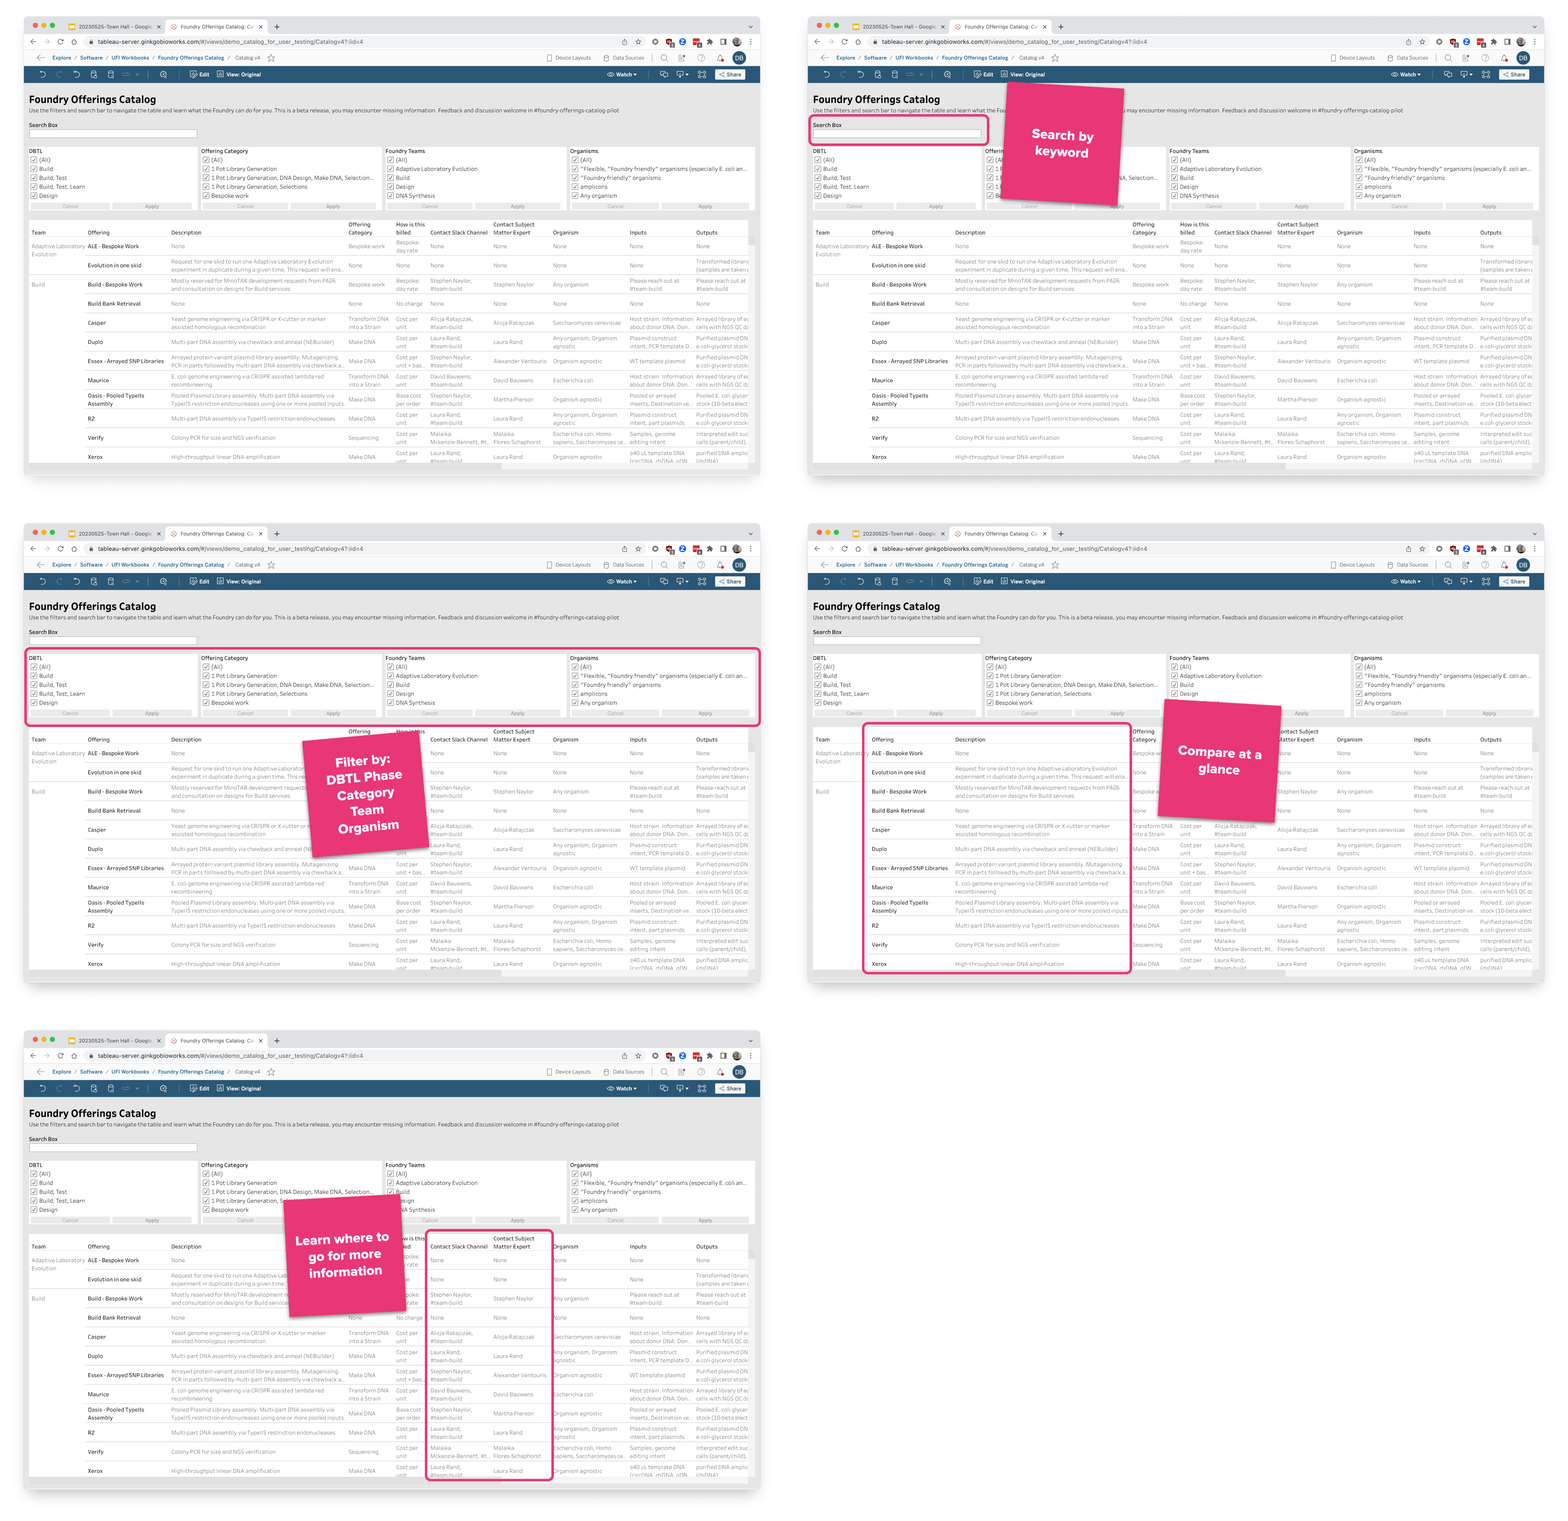
The initial product release
Outcomes
The dashboard was a cheap solution with an outsized impact
The dashboard used existing Ginkgo tooling and required almost zero engineering resources
The dashboard gave users access to info that was never written down in a single place
Prior to having a catalog, they used to track down this information via Slack and team meetings
I was invited to share the dashboard to the entire company at a town hall meeting which generated lots of excitement from both scientists and c-suite leadership
We hit our target KPIs for catalog adoption
I had previously worked with Ginkgo’s leadership to establish target KPIs for catalog adoption
One KPI measured percent of information filled out - we knocked this one out of the park thanks to the collaborative working relationship I established with scientific leaders
Our other KPI measured page views - we also hit this target. However, spiky traffic indicated a need for more awareness building through Product Management support
I handed off the catalog to a dedicated product owner
This project started off as a self-driven “side quest”. Nobody asked me to do it, but user research highlighted an unmet need so I secured the resources to solve the problem
The catalog eventually grew into more than a “side quest” and required a dedicated owner to ensure continued maintenance and adoption
Luckily, a product manager from a science team was eager to take over the catalog and grow the product
She has since integrated the catalog with other data sources and made further user-facing improvements
Today the catalog is widely considered an indispensable source of information at Ginkgo
I firmly believe the product worked because it’s creation was grounded in human centered design practices
That’s it, thanks for reading 👋
